10.9 qPCR结果快速分析示例
QPCR是实验设计中常见的分析,这里我们进行一项示例,能够快速帮助实验者构建qpcr的数据分析结果。
示例数据下载:1. Github下载地址 2. 百度网盘下载地址
10.9.1 qPCR数据导入
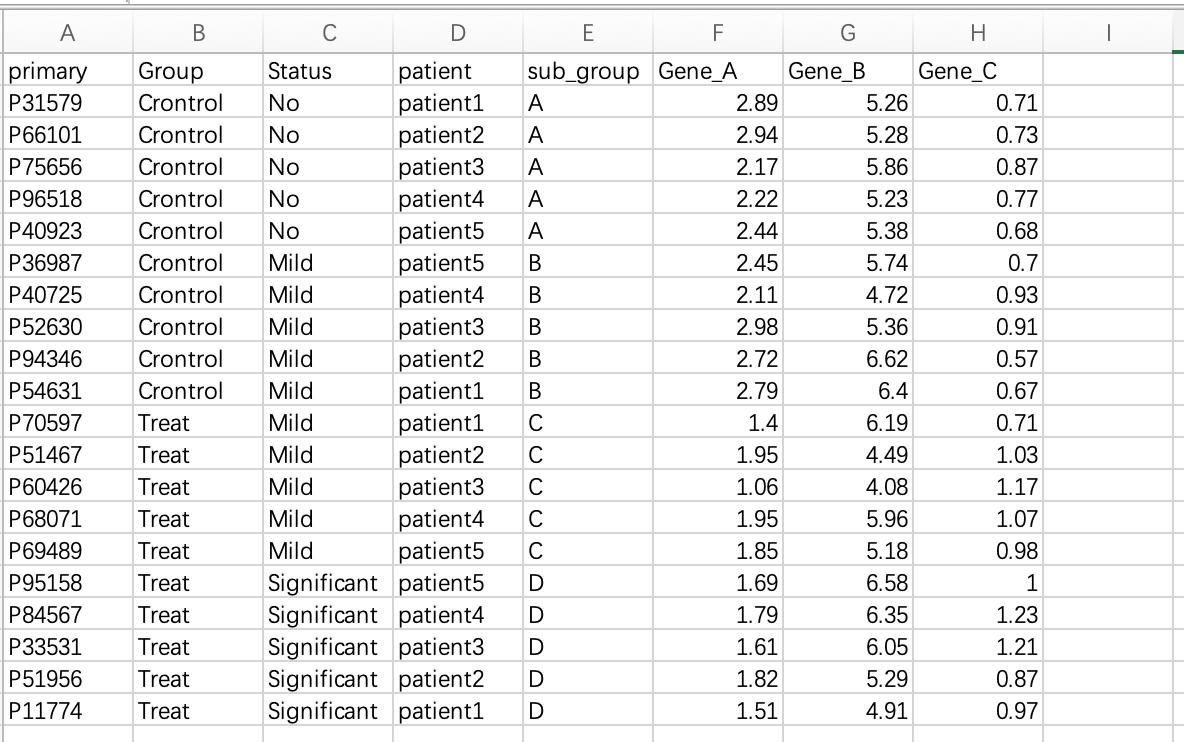
Step1:在excel文件中复制所需数据,并在R中执行。Gene_A, Gene_B, Gene_C为qpcr的表达值,其他为分组信息。
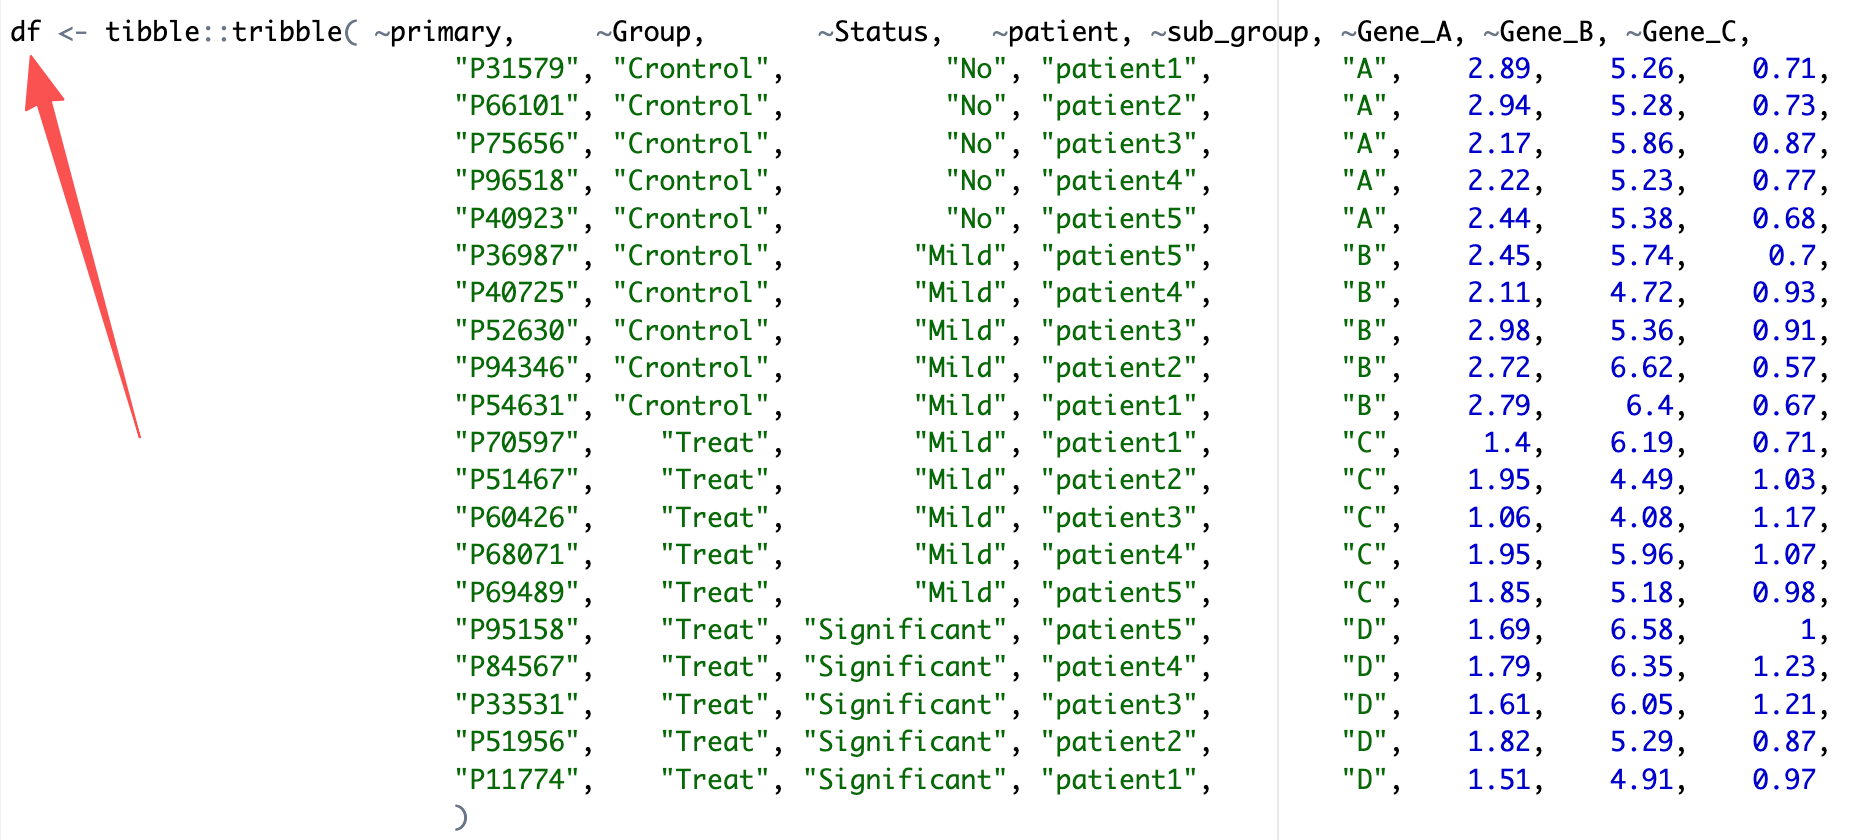
if (!requireNamespace("datapasta", quietly = TRUE))  install.packages("datapasta")
datapasta::tribble_paste()
Step2:在Rstudio界面,已自动地将复制的数据整理成表格格式,使用datapasta包的tribble_paste模块能将该数据框直接赋值为df并存储。
Step3:使用EasyMultiProfiler将df便捷导入MAE对象中。
library(EasyMultiProfiler)

coldata <- df |> dplyr::select(-Gene_A,-Gene_B,-Gene_C) |>
  tibble::column_to_rownames('primary') |>
  dplyr::mutate(Status = factor(Status,levels = c('No','Mild','Significant')))

assay_data <- df |>dplyr::select(-Group,-Status,-patient,-sub_group) |>
  tibble::column_to_rownames('primary') |> t() |> as.data.frame() |>
  tibble::rownames_to_column('feature')

MAE <- EMP_easy_import(data = assay_data,coldata = coldata,type = 'normal')
10.9.2 qPCR数据分析与可视化
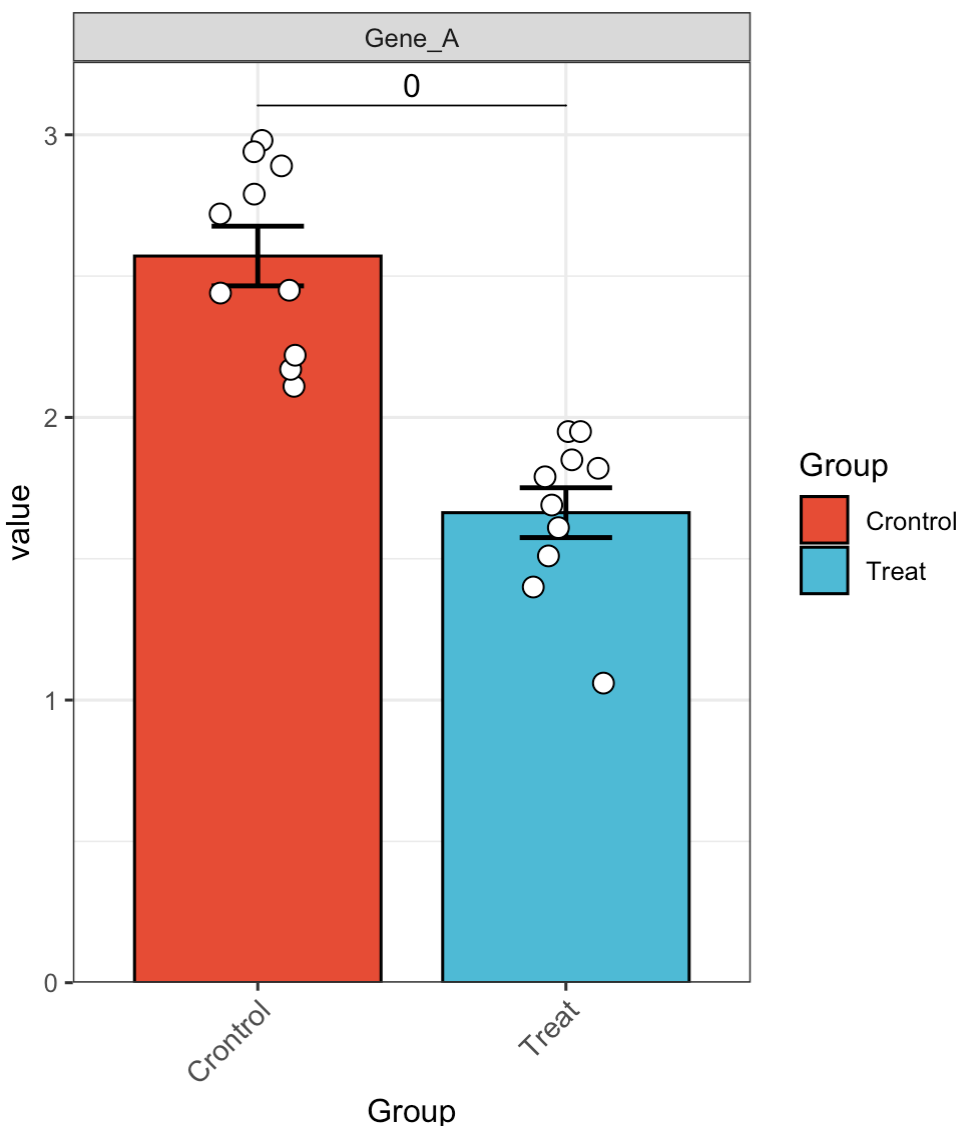
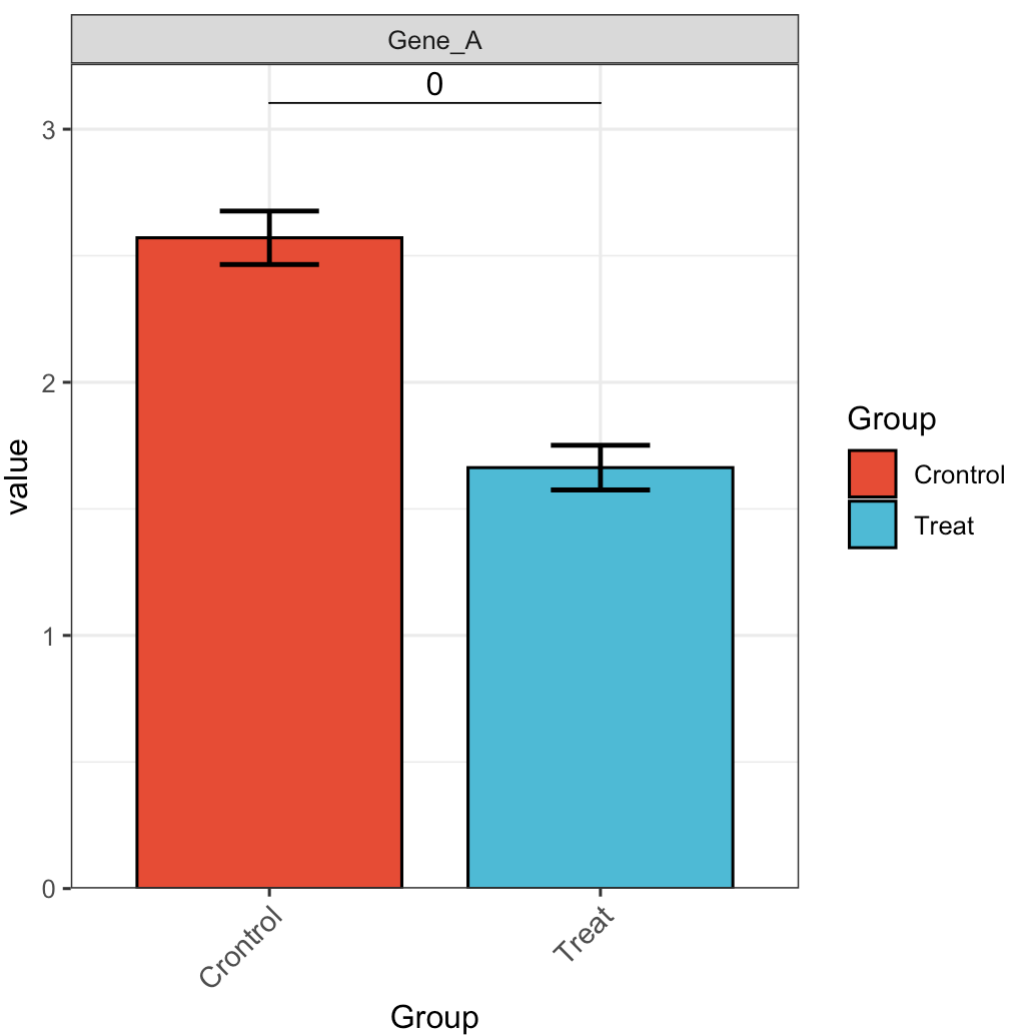
🏷️示例1: 快速分析单独基因的表达情况
MAE |>
  EMP_assay_extract() |>
  EMP_filter(filterFeature = 'Gene_A') |>
  EMP_barplot(estimate_group = 'Group',method = 't.test')
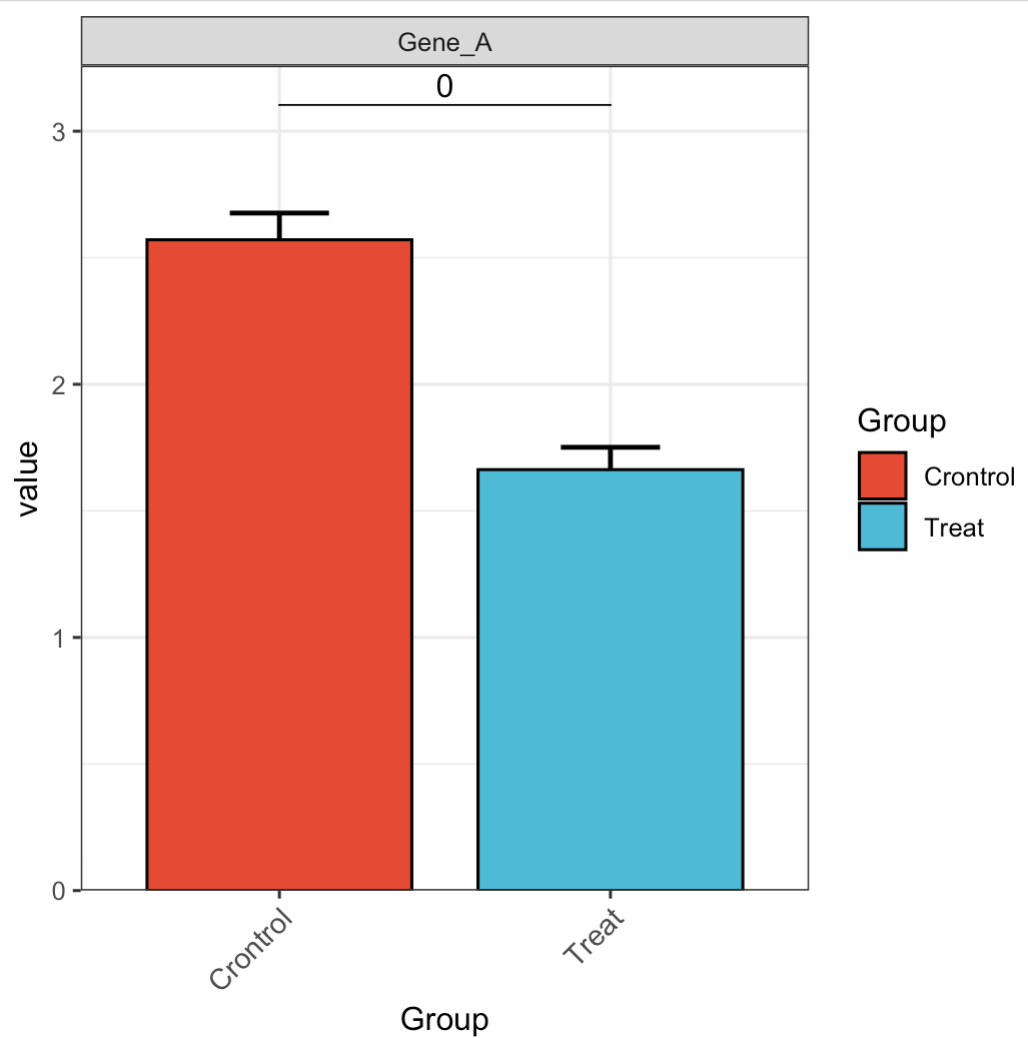
🏷️示例2: 隐藏散点。
MAE |>
  EMP_assay_extract() |>
  EMP_filter(filterFeature = 'Gene_A') |>
  EMP_barplot(estimate_group = 'Group',
              hide_point = TRUE,
              method = 't.test')
🏷️示例3: 调整误差条
MAE |>
  EMP_assay_extract() |>
  EMP_filter(filterFeature = 'Gene_A') |>
  EMP_barplot(estimate_group = 'Group',
              hide_point = TRUE,
              error_bar = 'upper',
              method = 't.test')
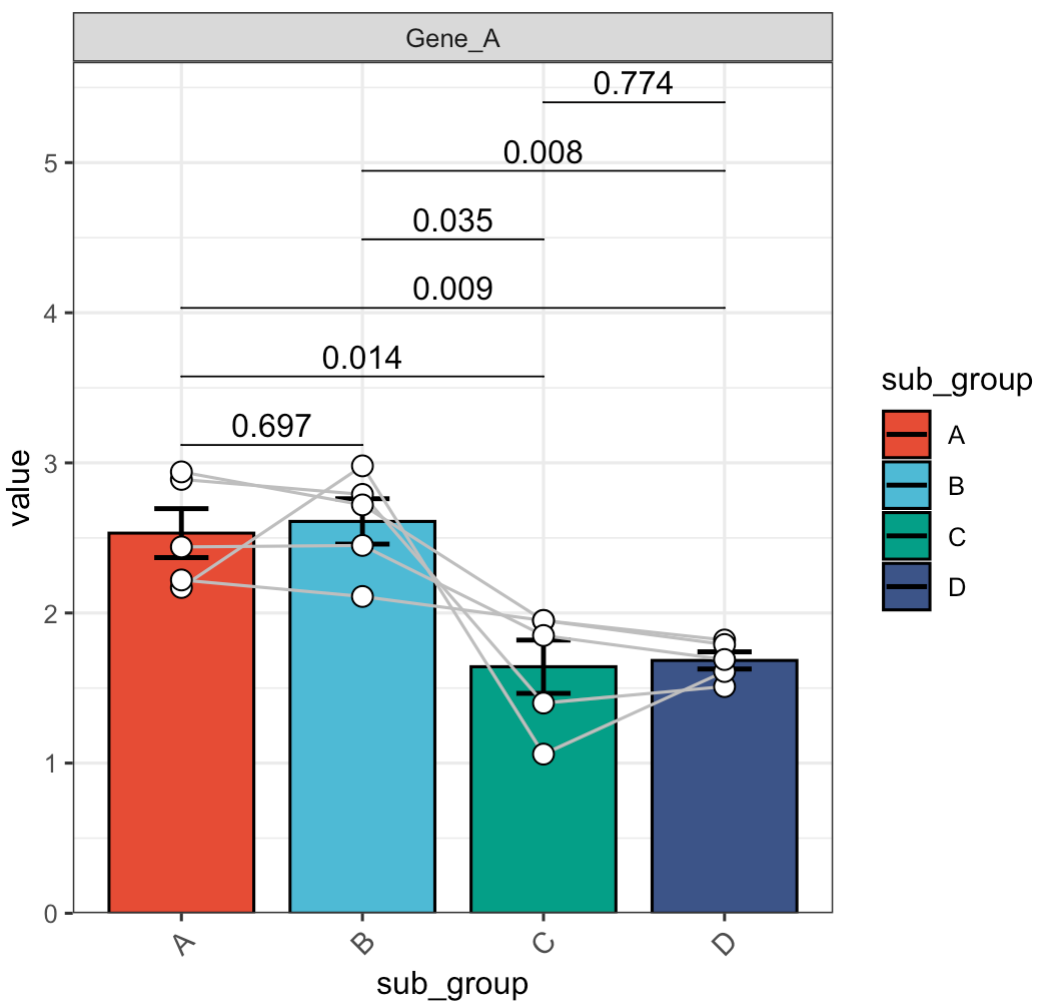
🏷️示例4: 配对检验
MAE |>
  EMP_assay_extract() |>
  EMP_filter(filterFeature = 'Gene_A') |>
  EMP_barplot(estimate_group = 'sub_group',
              method = 't.test',
              paired_group = 'patient')
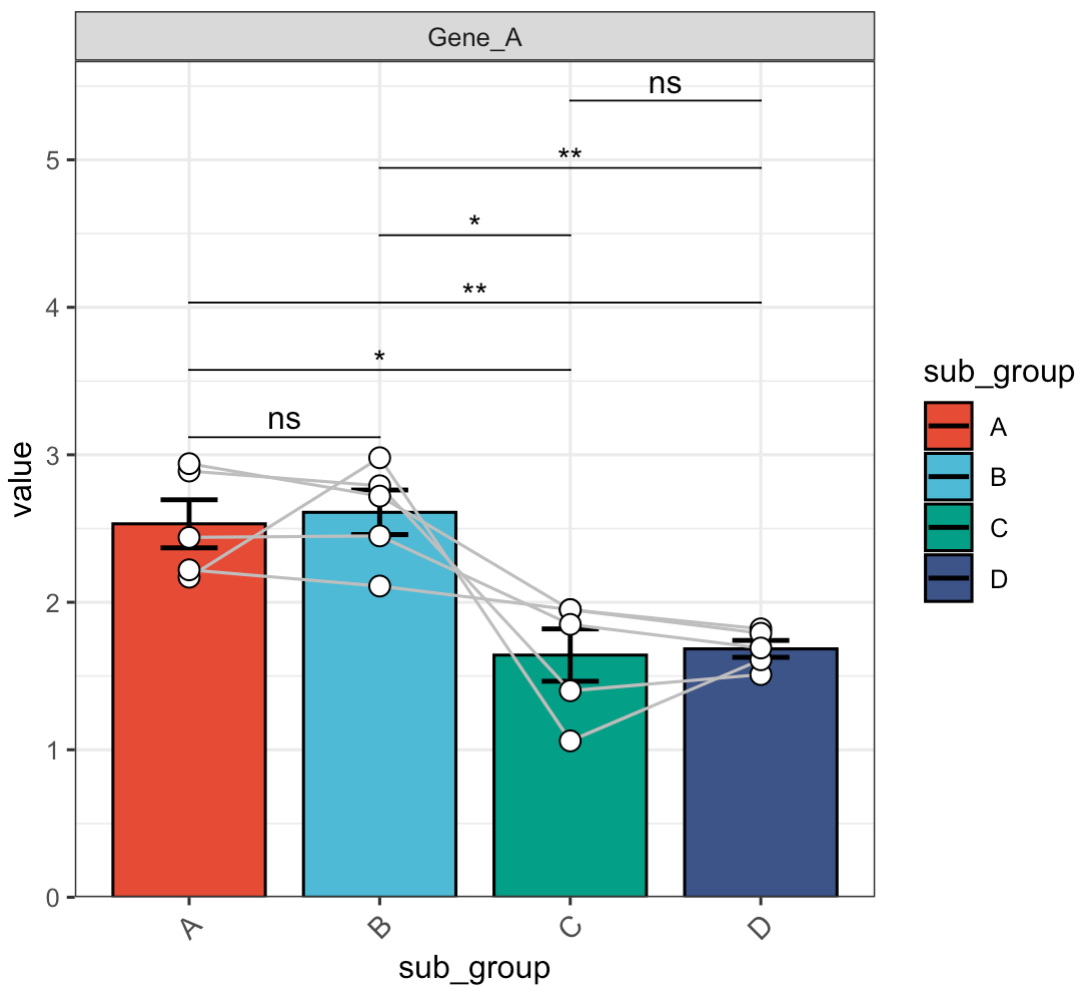
🏷️示例5: 调整差异标记。
MAE |>
  EMP_assay_extract() |>
  EMP_filter(filterFeature = 'Gene_A') |>
  EMP_barplot(estimate_group = 'sub_group',
              method = 't.test',
              paired_group = 'patient',
              label = 'p.signif')
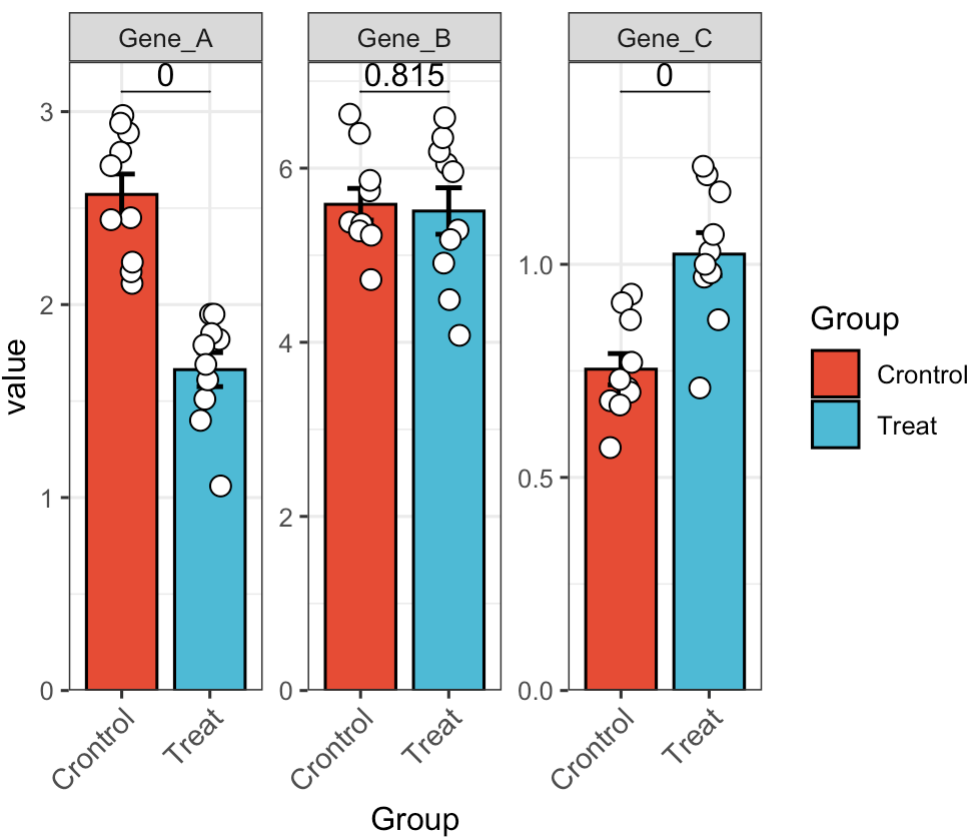
🏷️示例6: 多基因差异分析。
MAE |>
  EMP_assay_extract() |>
  EMP_barplot(estimate_group = 'Group',method = 't.test')
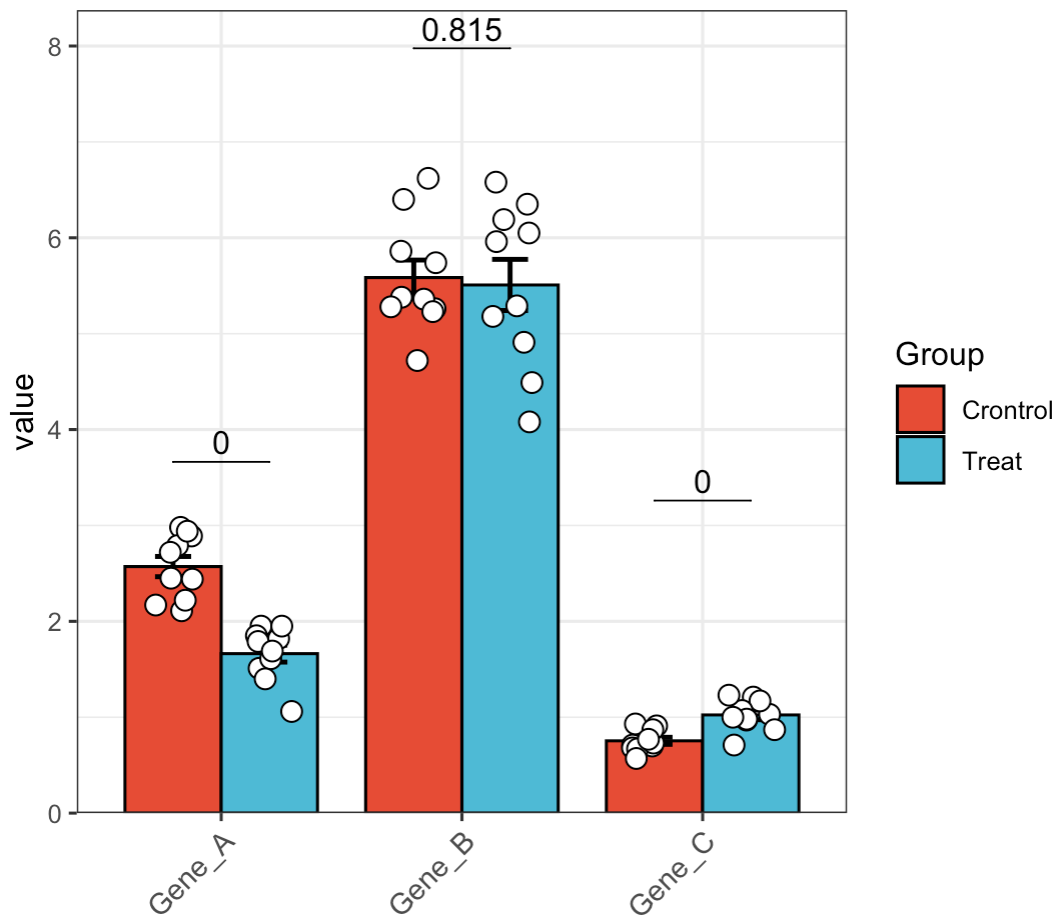
🏷️示例7: 多基因合并显示。
MAE |>
  EMP_assay_extract() |>
  EMP_barplot(estimate_group = 'Group',method = 't.test',facet = FALSE)
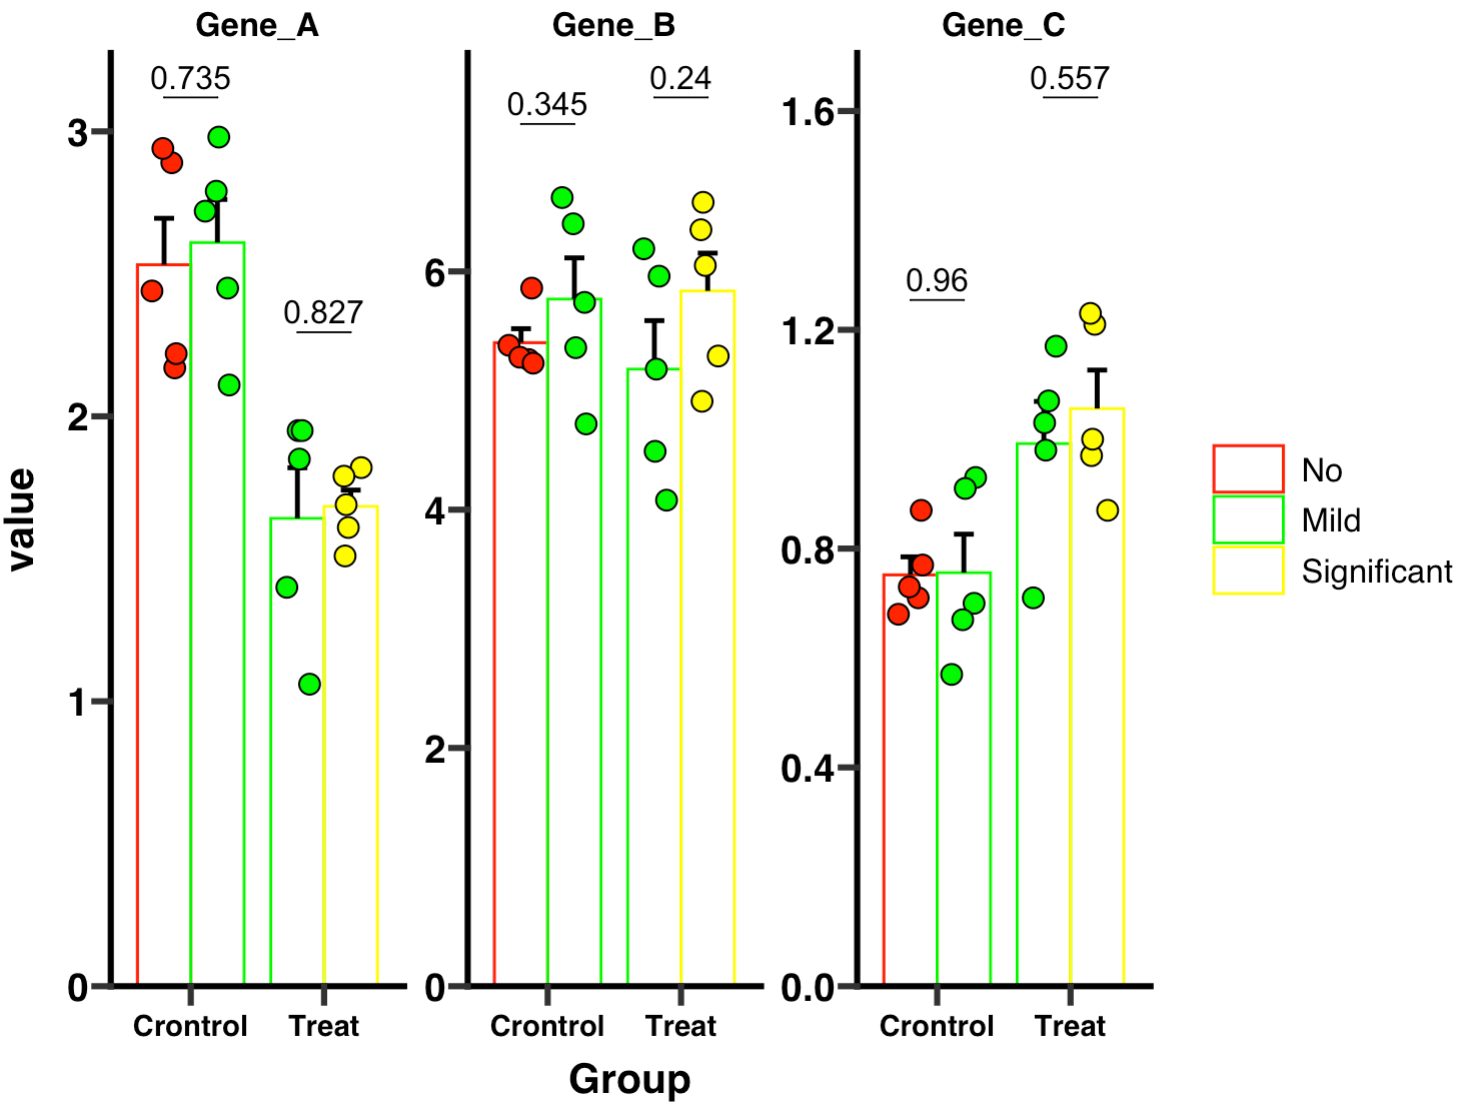
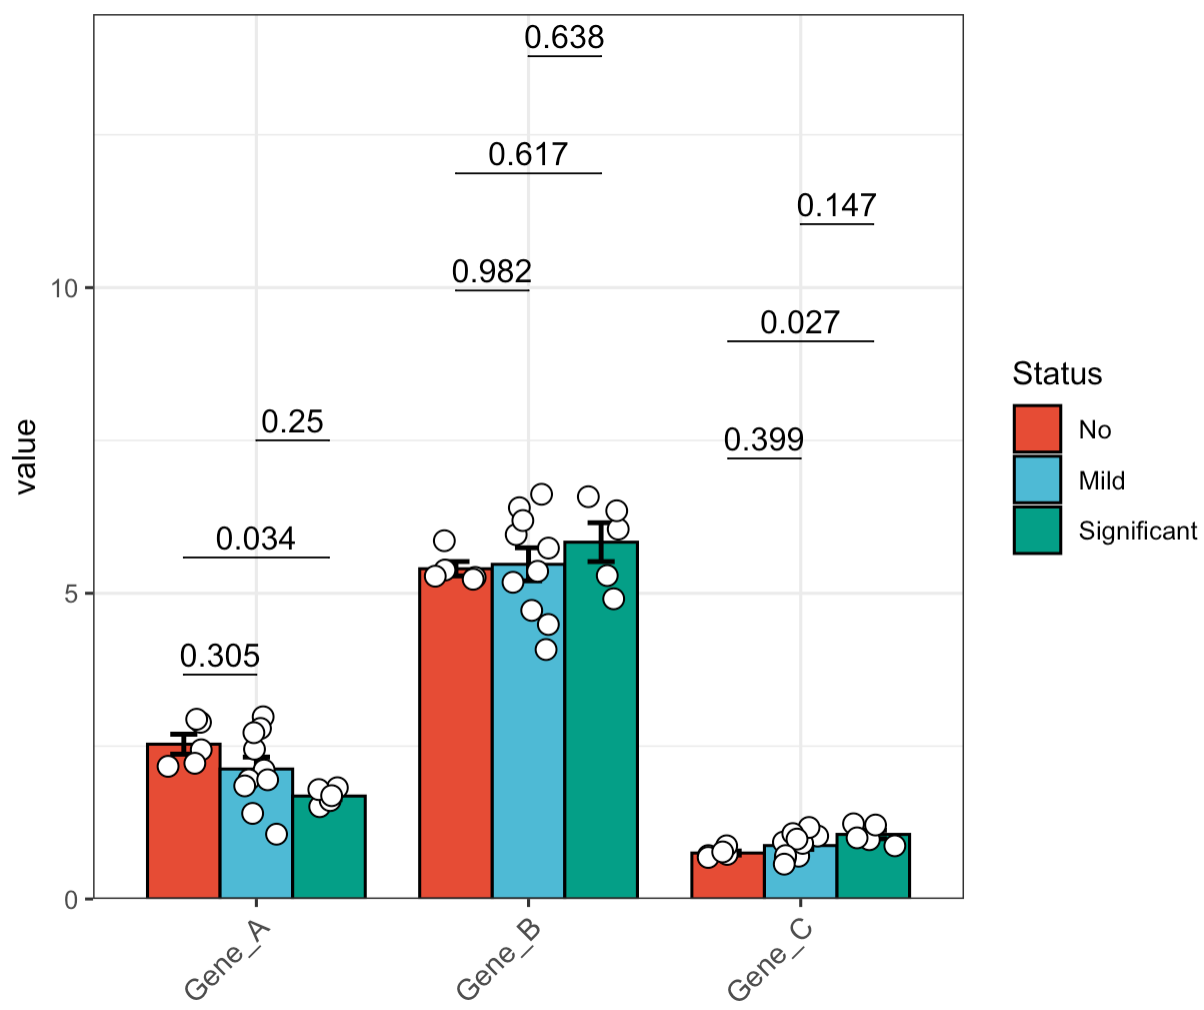
🏷️示例8: 亚组分析。 在进行多组分析时,如果数据属于正态分布,我们推荐使用tukey.hsd进行两两比较。如果数据非正态分布,也可以选择dunn.test进行两两比较。
MAE |>
  EMP_assay_extract() |>
  EMP_barplot(estimate_group = 'Group',compare_group = 'Status',
              method = 'tukey.hsd',facet = FALSE)
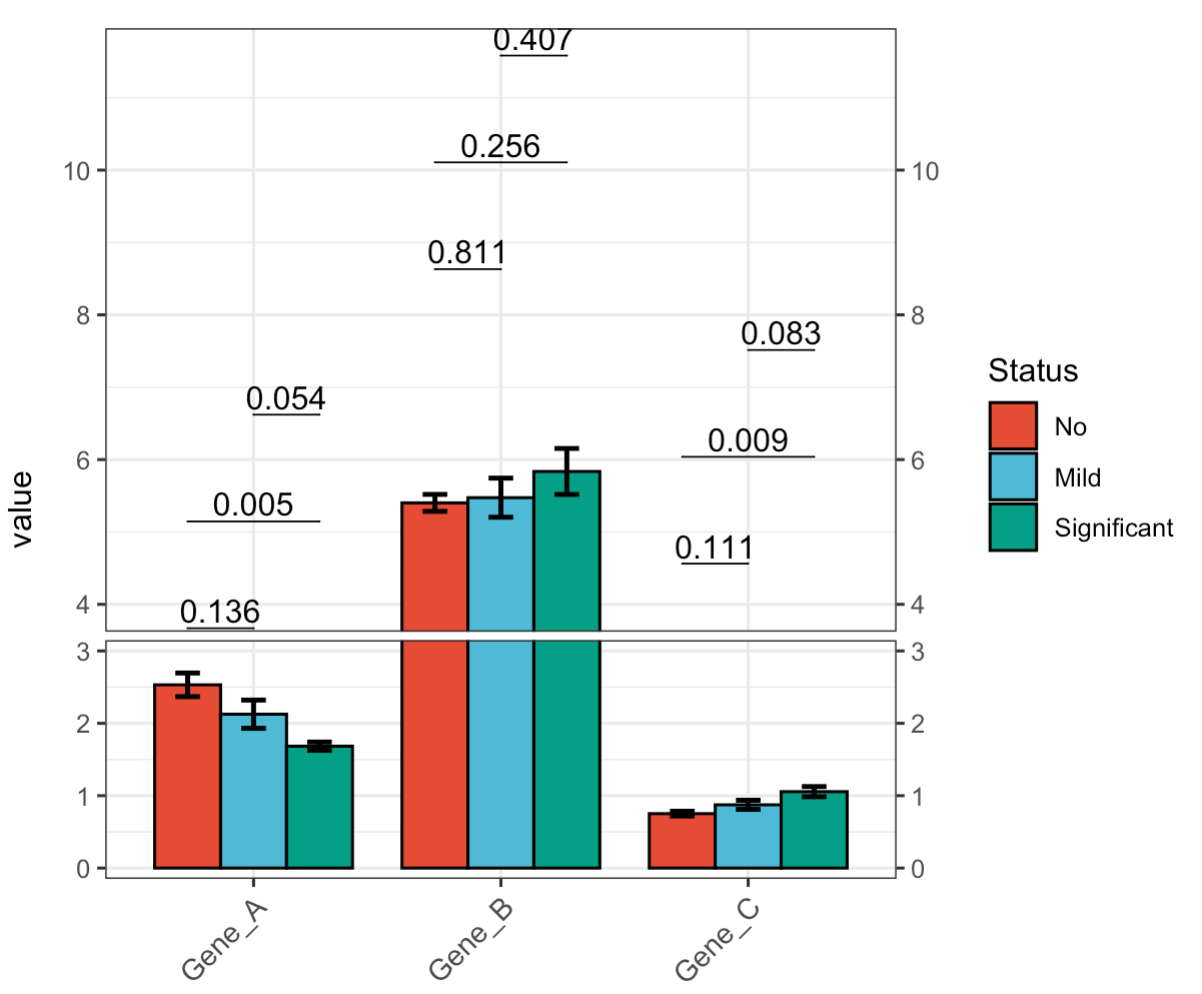
🏷️示例9: 断裂Y轴。
MAE |>
  EMP_assay_extract() |>
  EMP_barplot(estimate_group = 'Group',
              compare_group = 'Status',
              hide_point = TRUE,
              step.increase = 0.05,
              method = 't.test',facet = FALSE,
              y_break = c(3,4))
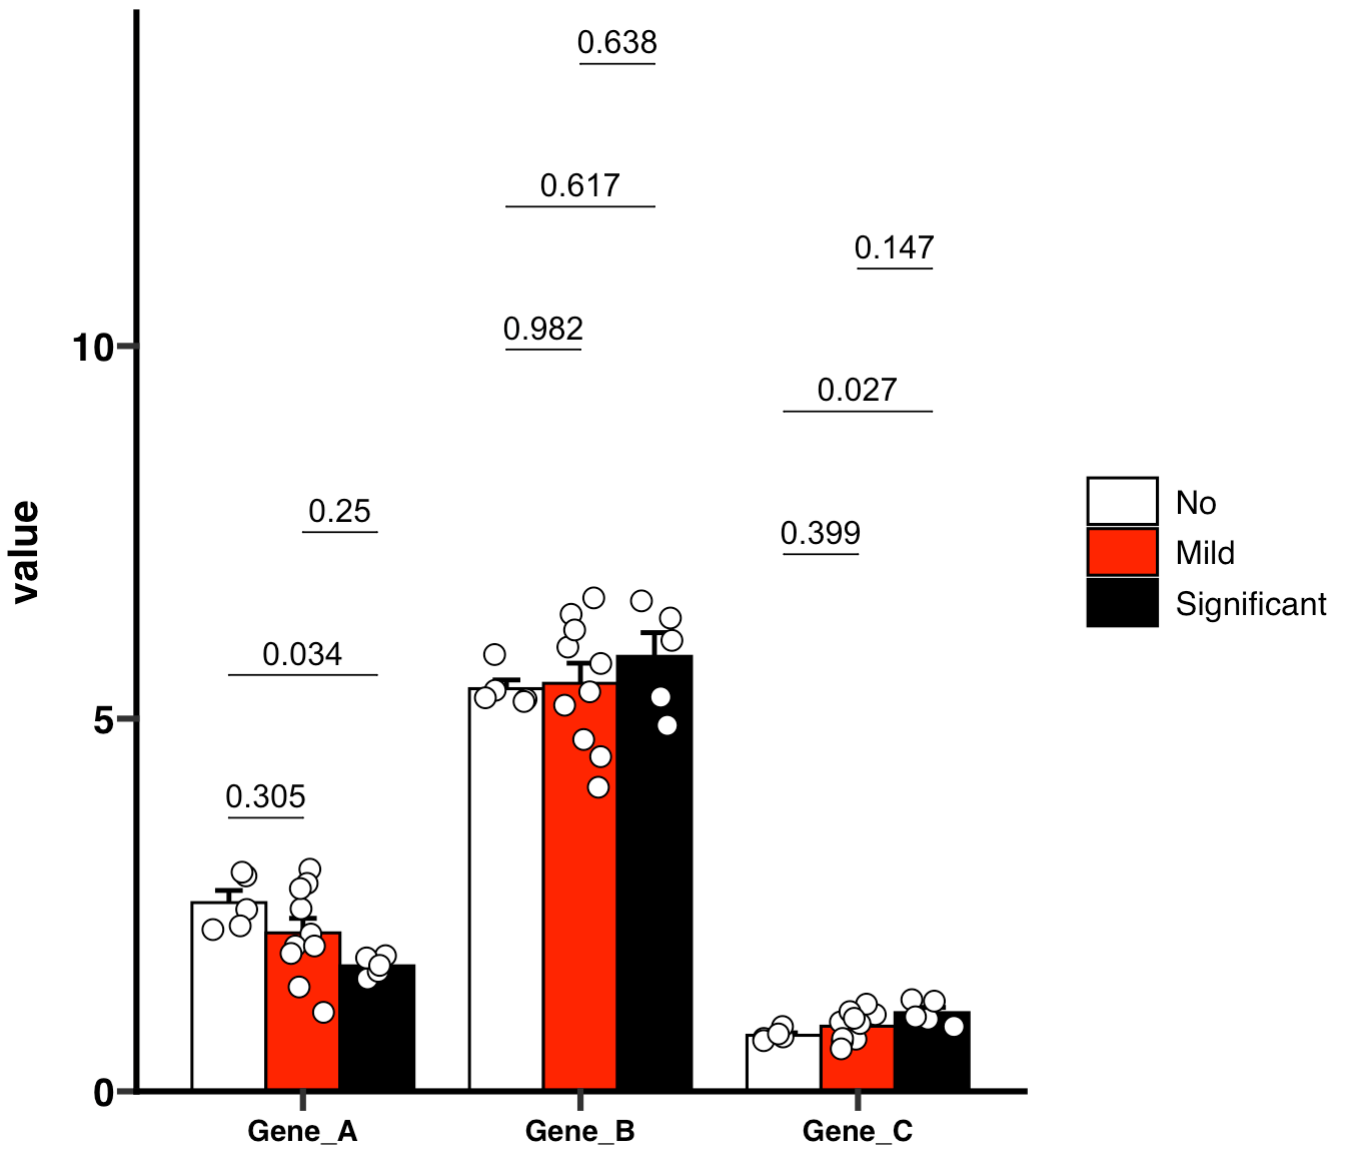
🏷️示例10: 绘制GraphPad风格的柱状图
if (!requireNamespace("ggprism", quietly=TRUE)) install.packages("ggprism")
library(ggprism)
MAE |>
  EMP_assay_extract() |>
  EMP_barplot(estimate_group = 'Group',compare_group='Status',
              palette = c('white','red','black'),error_bar = 'upper',
              method = 'tukey.hsd',facet = FALSE,
              mytheme ='theme_prism()')
🏷️示例11: 绘制GraphPad风格的空心图
MAE |>
  EMP_assay_extract() |>
  EMP_barplot(estimate_group = 'Group',
              bar_alpha = 0,bar_color = 'group',
              palette = c('red','green'),error_bar = 'upper',
              method = 'tukey.hsd',dot_color = 'group',
              mytheme ='theme_prism()')